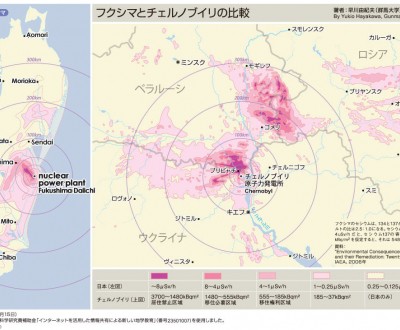
Fukushima / Chernobyl: a comparison map
Since the nuclear accident in Japan, following the 11/3/11 Tohoku earthquake and tsunami, Fukushima has often been compared to Chernobyl. Yukio Hayakawa, Volcanologist at the University of Gunma, came up with a document that puts side by side and concretely shows radioactive releases from the two disasters.
Hayakawa's maps have the advantage of being very graphic and we can easily compare the differences in propagation. The radioactivity data for Japan are in µSv/h (Sieverts), while those for Chernobyl are in kBqm² (Becquerels). Note that the Japanese map is 2011 December old, while the Russian map (with Belarus and Ukraine) is 2006 old.
For everyone's comfort of readings, I translated the names of Japanese cities on the map so that everyone can easily locate them in relation to nuclear contamination.
Note that last Friday was the stop of a 49th nuclear reactor in Japan. As for now, there are no more than 5 still in operation on Japanese territory, which should be gradually shut down by May 2012.

